

Lorenzo Biscontin
Last week, Gallup released the 2026 edition of its survey on American alcohol consumption, which it has conducted continuously since 1939.
The key findings are:
• 54% of US adults report drinking alcohol, a figure in line with last year’s record low.
• 13% say they sometimes drink too much, also a record low.
• 17% of Americans have replaced alcoholic beverages with non-alcoholic alternatives at least once in the past year.
The full research report can be found here.
In addition to publishing its survey report, Gallup also does something very commendable: it also makes the raw data available for responses to (almost) all questions.
An in-depth analysis of this data, specifically focusing on strategies that wine could implement to address the current period of declining consumption, proved to be a goldmine.
Here’s what I found, always keeping in mind that the sampling error is 4% for the total sample and 5% for the subsample that reported drinking alcohol.
You become a teetotaler.
Half of the 45% of Americans who now declare themselves teetotalers drank alcoholic beverages in the past.
Those who have become teetotalers are predominantly white, over 35, with College education, Republicans or Independents, and with a household income of less than $100,000/year.
The first consideration is that it would be extremely useful to further research this segment of consumers to understand the reasons why they became teetotalers.
A health-related change can be hypothesized for those over 55, but the same percentage of people dropping alcohol is also found among 35-45 year-olds, and the 38% of 18-34 year-olds who have given up alcohol should not be underestimated, given that these are people who started drinking relatively recently (remember, the legal drinking age in the US is 21).
The overall share of consumers who prefer spirits is growing, while that of beer and wine is decreasing.
In its report, Gallup shows the trend in the share of preference for the three types of alcoholic beverages within the sub-sample of alcohol drinkers.
I wanted to recalculate the data for the total population, so as to take into account the effect of the overall decline in alcohol consumption.
The new data are shown in Graph 1 below.
Chart 1
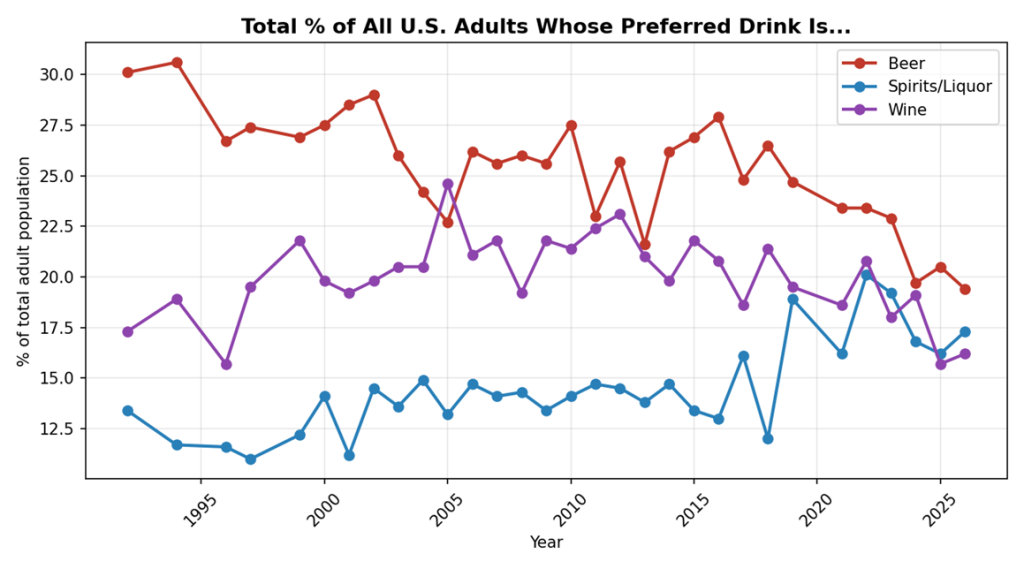
Beer is showing a declining trend since 1992; wine is declining after peaking in 2005 (surprised that it was the favorite alcoholic beverage of only 25% of Americans at best?), and spirits are catching up with the other two categories thanks to the jump in 2020 (the first year of COVID).
For spirits, it’s interesting to note how the increased preference among alcohol consumers has offset the decline in alcohol consumption overall, leading to growth of 1% in 2026, compared to a growth of half a point for wine and a decline of 1% for beer.
These trends cast doubt on the idea that the decline in wine consumption is mainly driven by the loss of purchasing power among US consumers. Lower purchasing power may affect alcohol consumption overall, but it does not put wine at a competitive disadvantage compared with other categories.
Indeed, if we look at the average price per serving, the most popular drink should be beer, priced between $5 and $8, compared to wine at $9 and $15, straight spirits at $8 and $12, and cocktails at $10 and $22.
The fact that beer is the category with the most significant decline indicates that other factors determine people’s choice of which alcoholic beverages to drink.
Due to the very structure of the Gallup survey, it’s impossible to know whether the increased preference for spirits is due to the entry of new alcohol consumers who prefer this category or a shift in preferences within the same “consumer base.”
However, analyzing the consumer profiles of the different types can provide us with some clues…
Beer, wine, and spirits consumers are very different.
Analyzing the sociodemographic data of those interviewed when asked about their favorite alcoholic beverage, clearly different profiles emerge.
• Beer drinkers are male, white, with College education or less, and politically Republican or Independent. There are no significant differences by age or household income.
• Wine drinkers are female, 55 or older, with Graduate education, Democrats, and with a household income of $100,000 or more.
• Spirits drinkers are woman, up to the age of 54, with education lower than College, vote for both Republicans and Democrats but not for Independent candidates, and lives in households with an income of up to $50,000/year.
These profiles seem to confirm the image of wine as a complex, elitist category, better suited to thinking / contemplation than enjoyment.
If it wants to conquer other market segments, wine must become more inclusive and therefore simpler. In a certain sense, it must descend from the pedestal it has deliberately built and erected for itself.
This is a need that in principle is increasingly shared within the wine industry, but it struggles to be implemented because there’s always someone who says, “Making wine more accessible is good, but beware of the risk of trivializing it.”
Aside from confusing accessibility and relevance with complexity and reverence, I would like to remind you that the trivialization of wine is a risk, while distance (rejection) for large segments of the market is a certainty.
The profiles above also confirm that the decline in disposable income has a relatively limited impact on the decline in consumption, as the most expensive category increases its share of preference, despite being purchased by the poorest consumers.
A lot of alcohol light drinkers, a little of heavy ones.
Chart 2 shows the frequency distribution of consumers based on the number of alcohol drink in the previous week.
Chart 2.
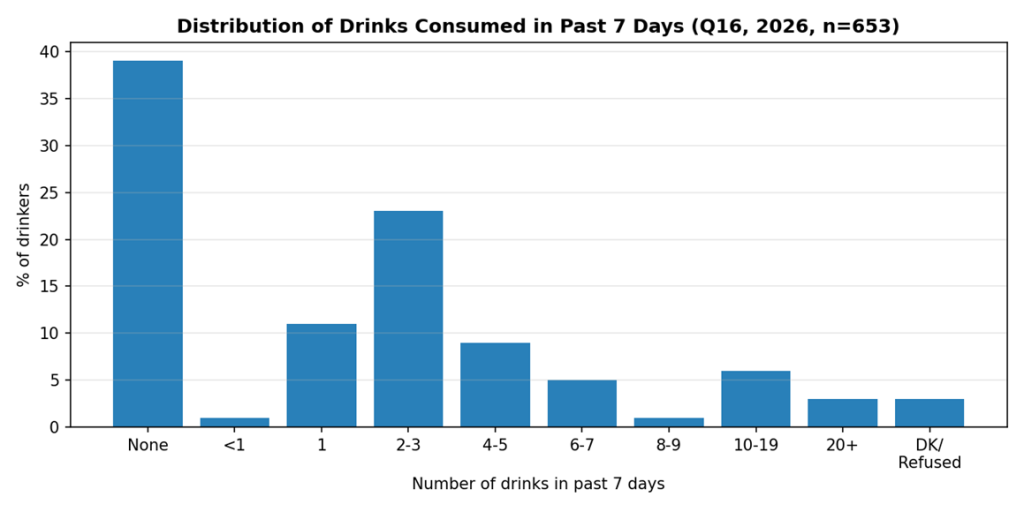
The largest group is that of alcohol consumers who did not drink at all in the previous week.
The other notable feature is the sharp decline after “2-3” drinks.
Three clusters can therefore be identified:
1) Occasional drinkers, who have not drunk anything in the past week and represent 39% of those who drink alcohol.
2) Light drinkers, with consumption between <1 and 2-3 drinks per week, representing 34% of those who drink alcohol.
3) Heavy drinkers, who consume more than 6-7 drinks per week, they make up 24% of alcohol drinkers.
To develop new wine consumption in the medium to short term, the most interesting cluster is that of light drinkers, especially the 11% who drunk one drink the previous week.
Increasing half of these consumers from one to two drinks a week increases overall consumption by approximately 2%, while increasing their consumption to three drinks a week increases overall consumption by approximately 3%.
Another factor that makes light drinkers particularly interesting for the wine sector is that in this cluster consumers with Grad education are overrepresented.
The cluster of occasional drinkers also has great potential, given its large number. The priority here should be further in-depth research to understand the reasons for this sporadic consumption and then develop the most appropriate strategies.
Heavy consumers, on the other hand, already have high consumption levels and are therefore difficult to increase with the same cost-benefit ratio that can be achieved by investing in light consumers.
Chart 3 compares the frequency distributions by quantity consumed in the last week in 2026 and 2019 (chosen because it was the last year before COVID).
Chart 3.
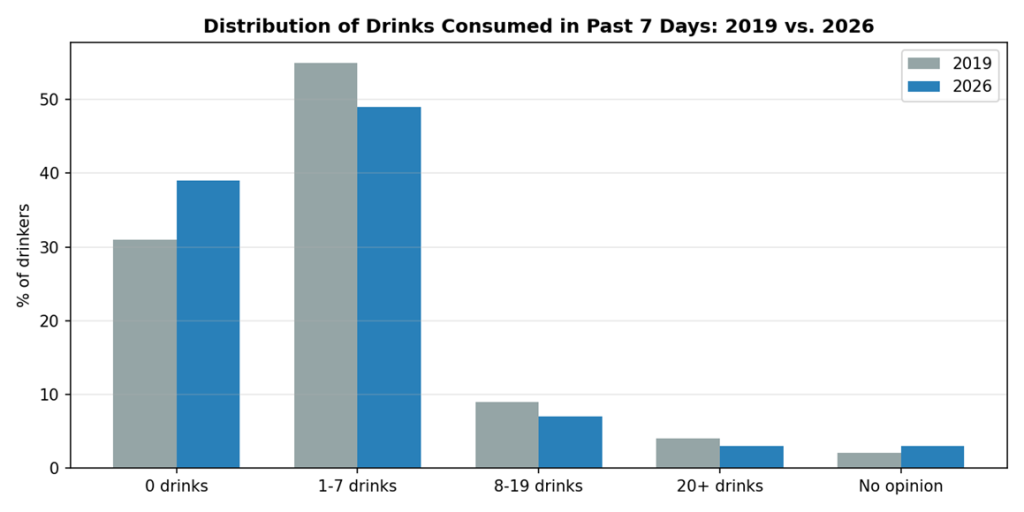
The percentage of those reporting zero glasses increased by almost 10 points, while the percentage of consumers decreased at all consumption levels.
This further demonstrates the need for action by wineries and industry associations if the decline in consumption is to be reversed or at least slowed.
Who increased their consumption of non-alcoholic alternatives?
17% of the total sample reported drinking non-alcoholic alternatives to beer, wine, or spirits in the previous year.
Of these, 33% reported drinking more than last year.
These consumers are under 54, have a Grad education, vote Democrat, and have a household income of over $100,000/year.
This profile largely overlaps with that of wine consumers, except for its younger age. Wine producers operating in the US market that choose not to enter the alcohol-free wine segment do so at their own peril.
Final personal and methodological note.
All the analyses reported in this article are the result of my elaborations on the detailed data from the survey published by Gallup and downloadable from their website.
I do believe this analysis provides extremely clear and interesting strategic and operational insights.
The kind of information you would normally obtain by paying several thousand euros to a specialized research institute.
I hope that the fact that it is free and the result of the work of a single person does not lead to its underestimation.